Intelligent monitoring
Monitoring that you can trust on
Website monitoring
Know how your services are performing
Depending on many different things, a service outage could be a huge mess. If you are an administrator, you know, that root cause analysis could be tricky but it essential for problem-solving.
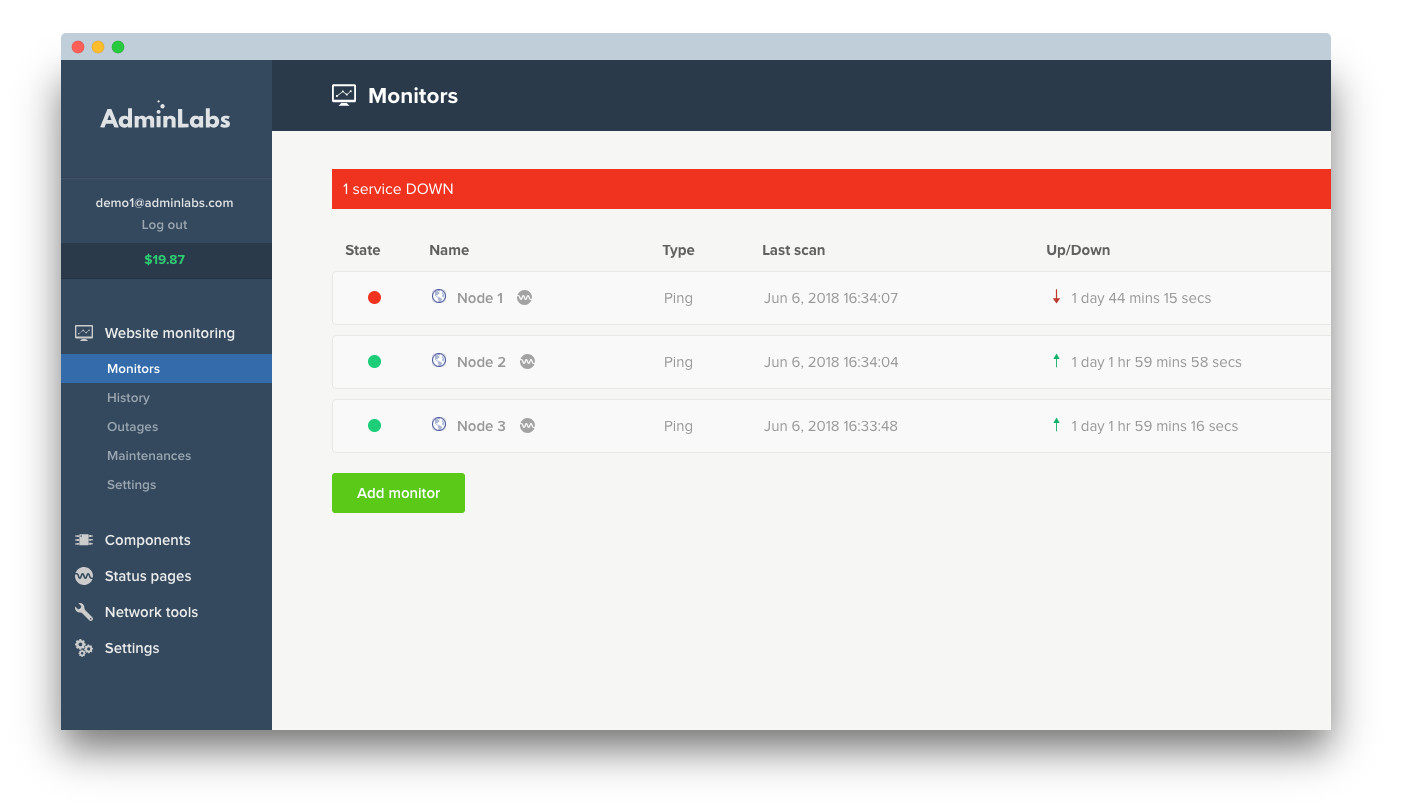
With AdminLanbs' Dashboard, it is easy to see the overall image of the ongoing disaster. What was the first service that went down and happened after that? Login to Dashboard and find the answer.
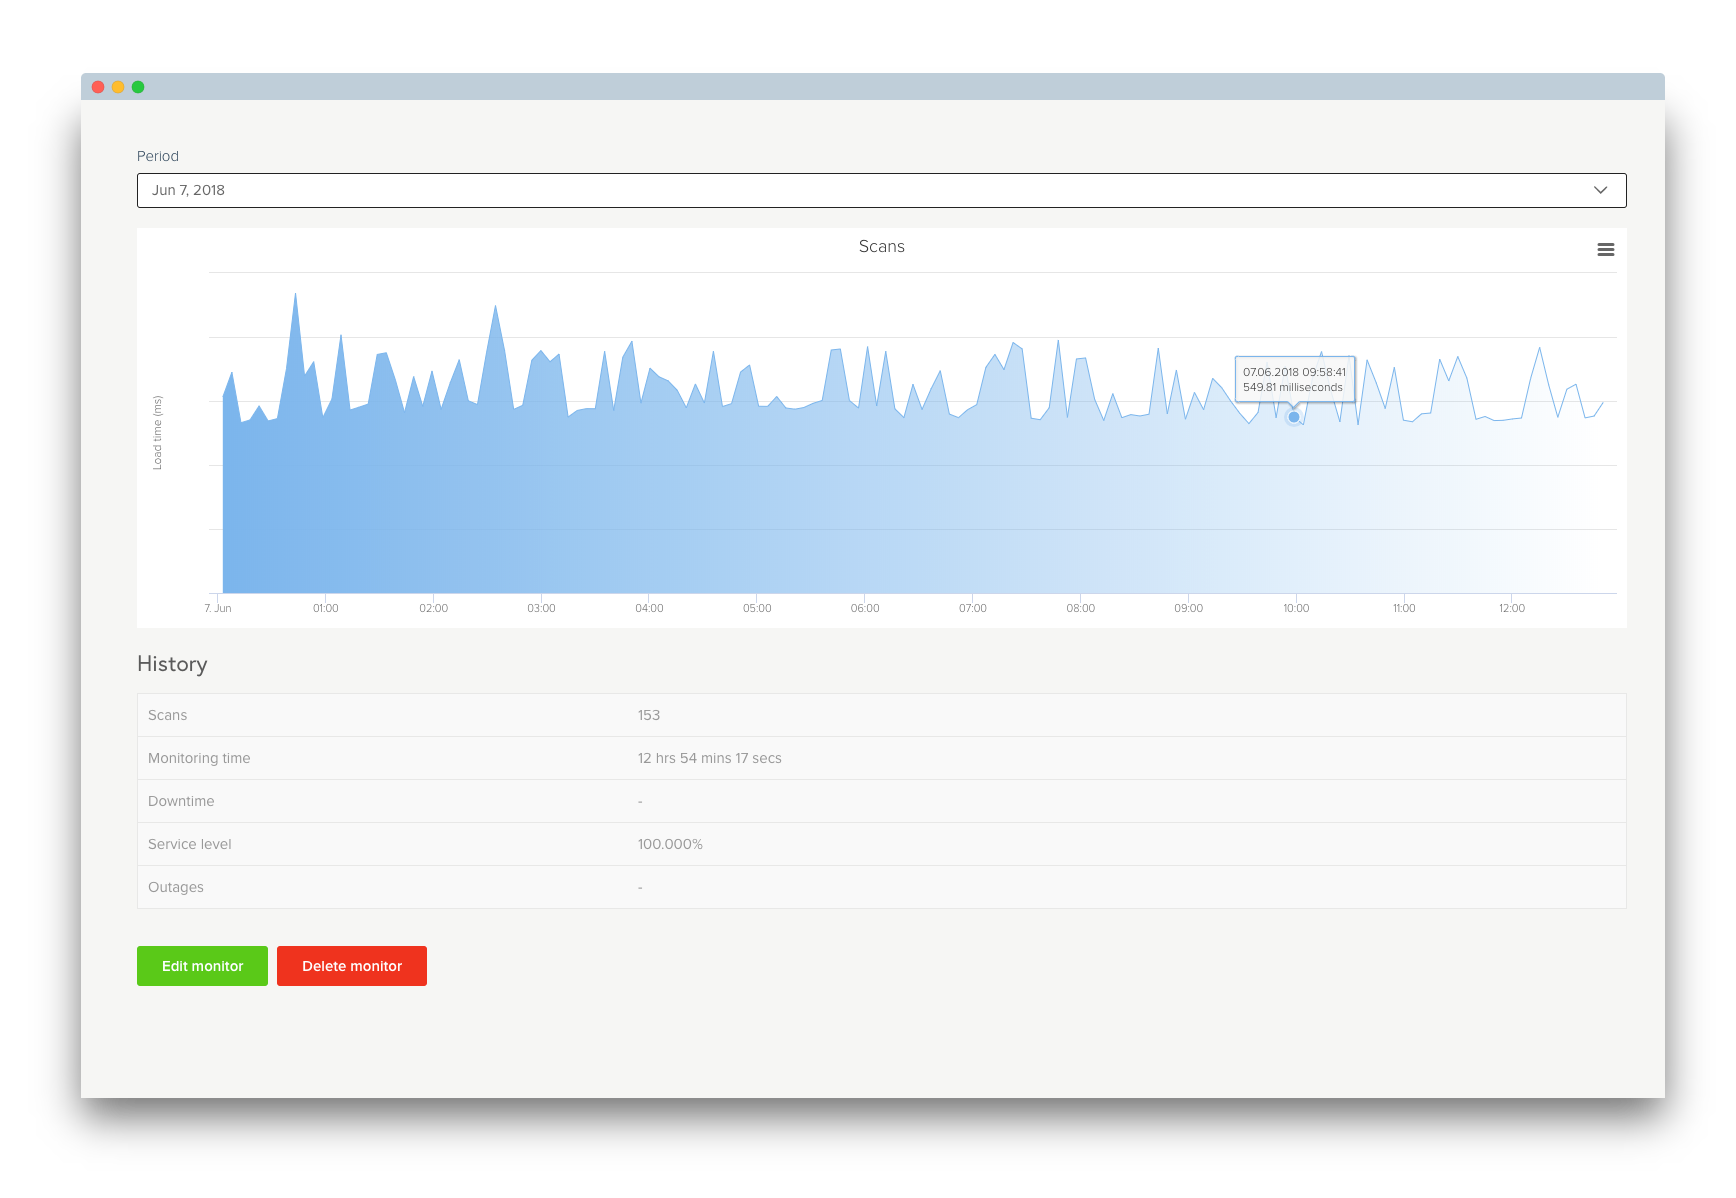
There is always someone who is asking the uptime of your service. It could be your customer who is interested if you have filled the SLA percent or your boss who need to know if there is a good reason to reward service production team because of a well-done job.
From Dashboard you can find for example:
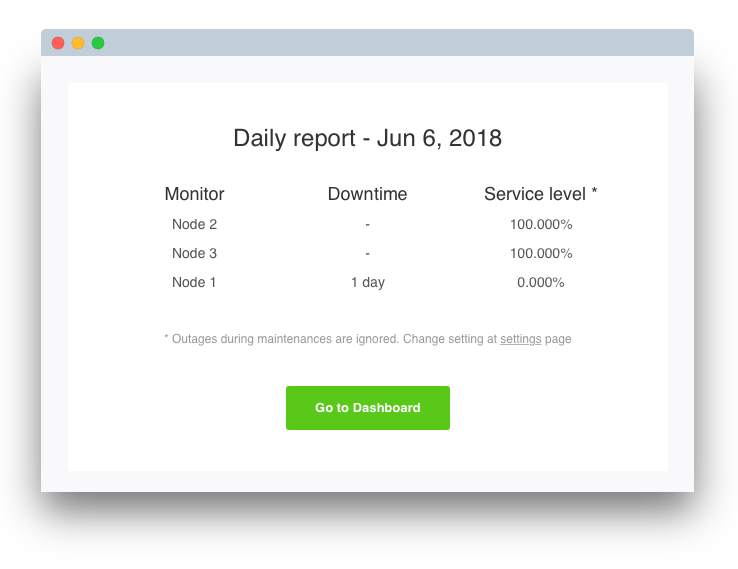
Interested in reading uptime reports while drinking a morning coffee? No problem, we have made it possible! You can even choose if you want your uptime figures with or without scheduled maintenance.
Just log in to Dashboard and selected when you want to receive email reports: